Data Is Your Competitive Advantage
The most successful Shopify stores make decisions based on data, not gut feelings. Understanding your metrics enables you to identify what is working, fix what is broken, and allocate resources for maximum return. Our strategy consultancy helps brands build data-driven decision frameworks.
Essential Ecommerce Metrics
Revenue Metrics
- Gross revenue: Total sales before deductions
- Net revenue: Revenue minus returns, discounts, and fees
- Average order value (AOV): Revenue divided by number of orders
- Revenue per visitor (RPV): Revenue divided by sessions — the ultimate efficiency metric
Conversion Metrics
- Conversion rate: Visitors who complete a purchase (industry average: 1.5-3%)
- Add-to-cart rate: Visitors who add items to cart (target: 8-12%)
- Cart-to-checkout rate: Cart visitors who start checkout
- Checkout completion rate: Checkout starters who complete purchase
Customer Metrics
- Customer acquisition cost (CAC): Marketing spend to acquire one customer
- Customer lifetime value (LTV): Total revenue expected from a customer
- LTV:CAC ratio: Should be at least 3:1 for sustainable growth
- Repeat purchase rate: Percentage of customers who buy again
Shopify’s Built-In Analytics
Dashboard Overview
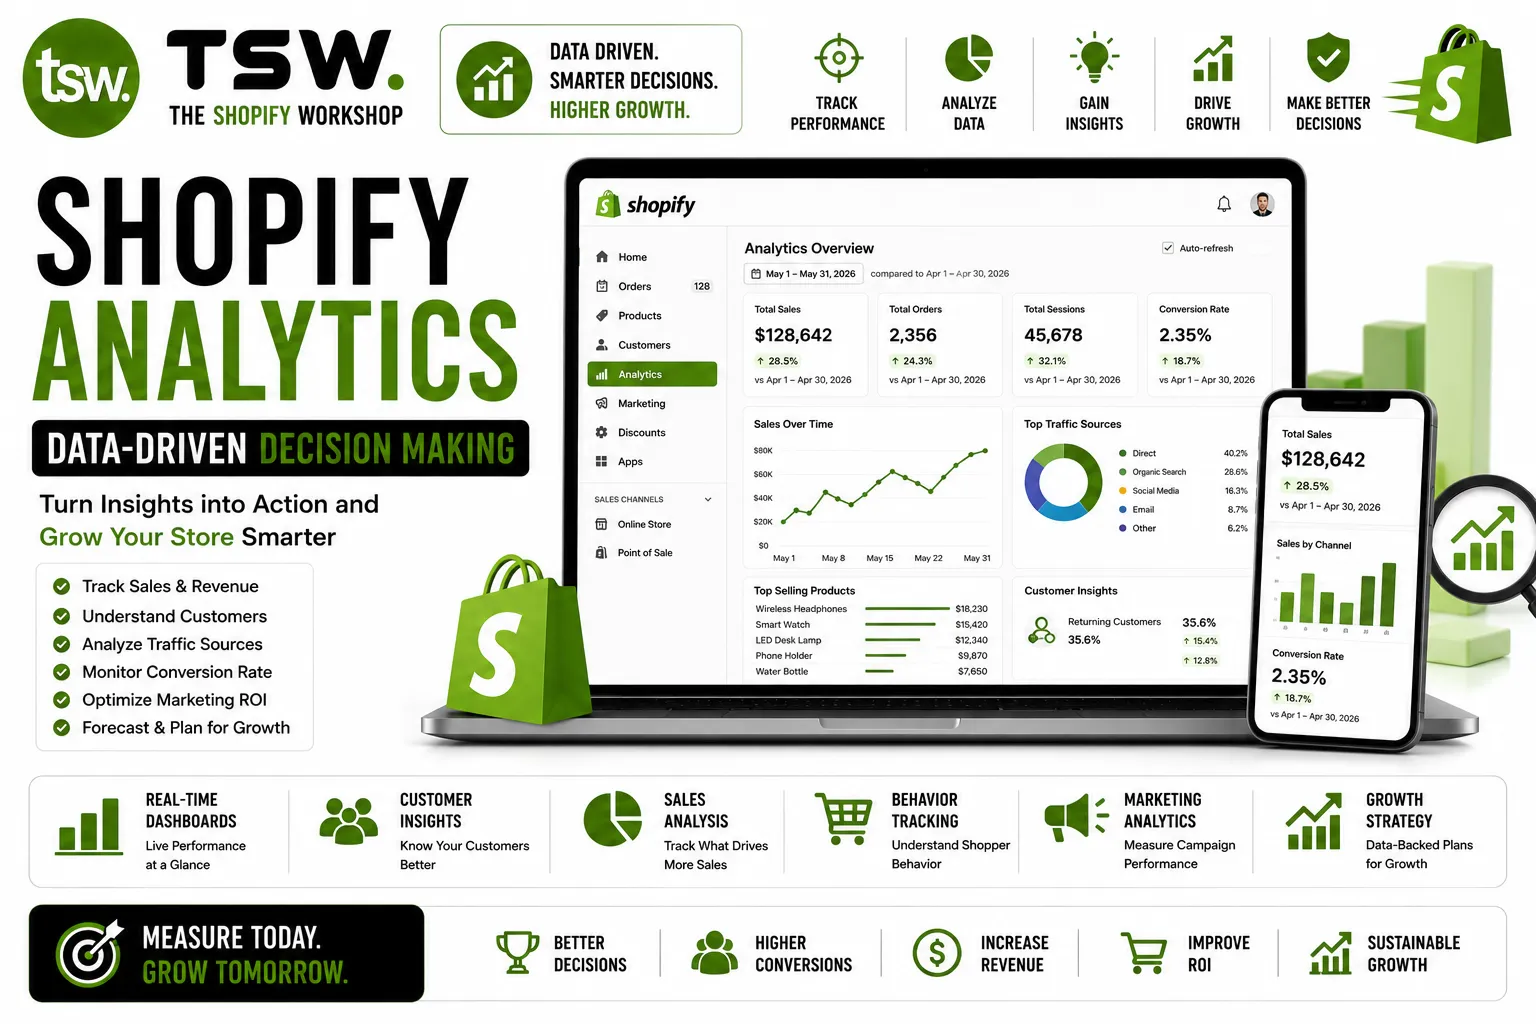
Shopify’s dashboard shows real-time sales, session data, and order activity. Use it for quick health checks but do not rely on it alone. The built-in reports provide more depth for products, sales, customers, and marketing channels.
Sales Reports
Analyse sales by product, variant, discount code, staff, and channel. Identify your bestsellers, highest-margin products, and underperformers. Use time comparison to spot trends and seasonal patterns.
Customer Reports
Track customer acquisition, retention, and predicted spend. Shopify’s customer reports show first-time vs returning customer revenue split, which reveals how dependent you are on new customer acquisition.
Beyond Shopify Analytics
Google Analytics 4
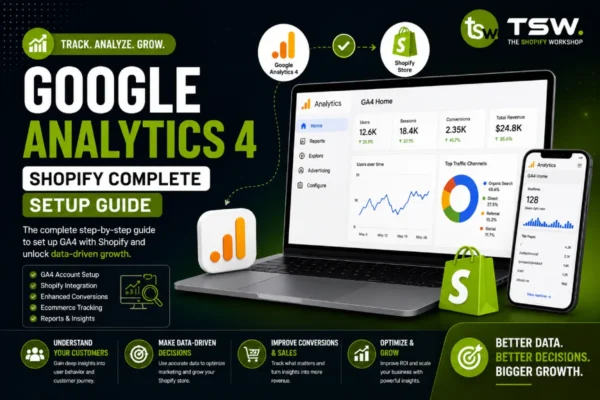
GA4 provides deeper insights into user behaviour, traffic sources, and cross-device journeys. Set up enhanced ecommerce tracking, custom events, and conversion funnels for a complete picture. Our marketing team configures GA4 for maximum insight.
Attribution Modelling
Understand which marketing channels truly drive sales, not just which ones get the last click. Multi-touch attribution models credit each touchpoint in the customer journey. Tools like Triple Whale and Northbeam provide ecommerce-specific attribution.
Turning Data into Action
Weekly Metrics Review
Establish a weekly cadence for reviewing key metrics. Track trends, identify anomalies, and make data-informed adjustments. Weekly reviews prevent problems from festering and capitalise on opportunities quickly.
Monthly Deep Dives
Monthly analysis of customer cohorts, channel performance, product category trends, and funnel conversion. These deeper reviews inform strategic decisions about product development, marketing allocation, and conversion optimisation priorities.
Common Analytics Mistakes
- Vanity metrics: focusing on traffic instead of revenue per visitor
- Short-term thinking: daily fluctuations versus monthly trends
- Ignoring segments: overall averages hide important differences
- Attribution oversimplification: giving all credit to last click
- Analysis paralysis: collecting data without acting on insights
Need help with analytics strategy? Build your data framework with our team.