
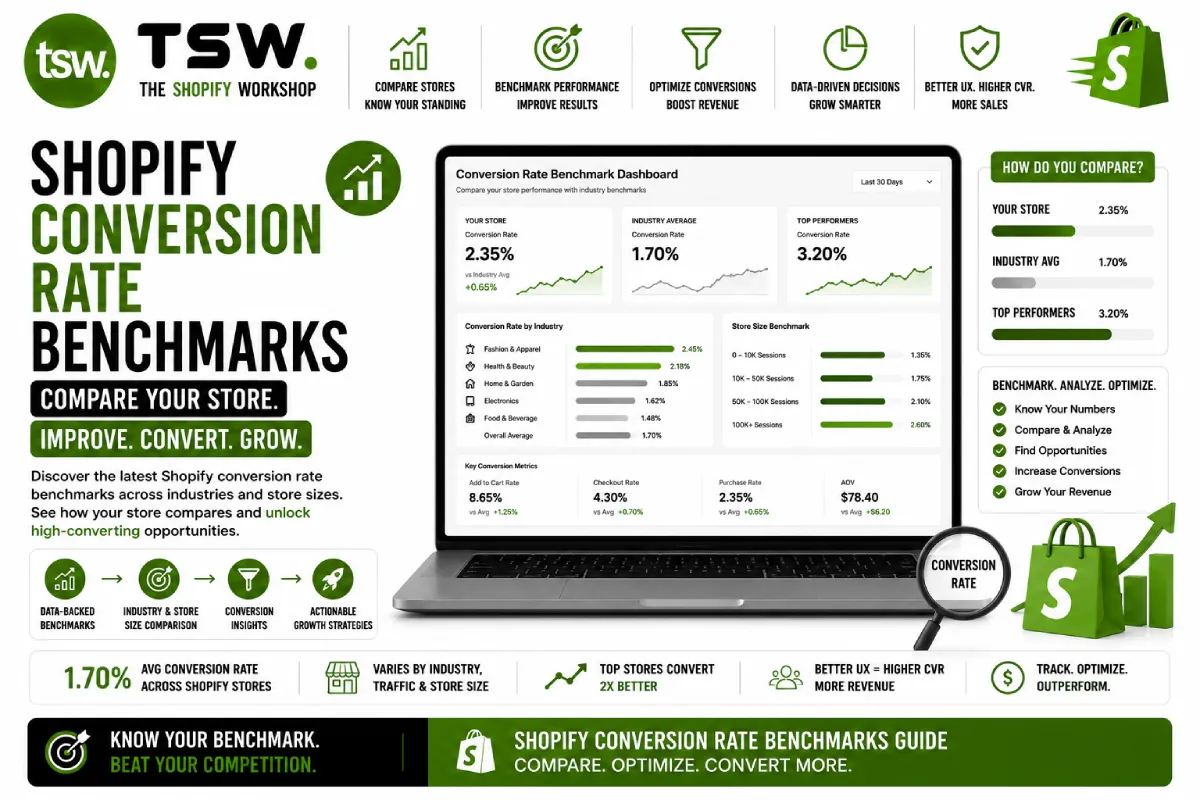
Know Where You Stand
Benchmarks provide context for your metrics. A 2% conversion rate might be excellent for luxury fashion but concerning for consumable products. Understanding industry benchmarks helps you set realistic targets and identify improvement opportunities. Our CRO services use benchmark data to prioritise optimisation efforts.
Overall Shopify Conversion Rates
Average Benchmarks
- Overall Shopify average: 1.4% conversion rate
- Top 20% of stores: 3.2%+ conversion rate
- Top 10% of stores: 4.7%+ conversion rate
- Desktop: 2.1% average (higher than mobile)
- Mobile: 1.2% average (lower but growing)
Benchmarks by Industry
Fashion and Apparel
Average: 1.5-2.5%. Size uncertainty and style preferences drive higher browse-to-buy ratios. Strong product photography, detailed size guides, and easy returns policies improve conversions in this category.
Health and Beauty
Average: 2.5-3.5%. Repeat purchase nature and lower price points help. Strong reviews, before/after imagery, and subscription options boost rates. One of the better-converting categories online.
Home and Garden
Average: 1.0-2.0%. Higher price points and the need to see products in context create longer consideration cycles. AR/3D views and lifestyle photography help close the gap.
Food and Beverage
Average: 2.0-4.0%. Consumable nature drives repeat purchases. Subscription models, bundle offers, and taste/sample programmes convert browsers into long-term customers.
Benchmarks by Traffic Source
- Email: 4-6% (highest — warm, engaged audience)
- Direct: 2-4% (brand familiarity drives conversions)
- Organic search: 2-3% (intent-driven traffic)
- Paid search: 1.5-3% (keyword-targeted, high intent)
- Social media: 0.5-2% (discovery-driven, lower intent)
- Display/retargeting: 0.5-1.5% (awareness and remarketing)
Other Key Benchmarks
Average Order Value
Overall Shopify average: £75-85. Varies hugely by industry — fashion averages £65, electronics averages £120, luxury averages £250+. Track AOV trends monthly and implement strategies like bundling and upselling to grow it.
Cart Abandonment Rate
Industry average: 69-72%. Anything below 65% is good; below 55% is excellent. Reduce through transparent pricing, guest checkout, express payments, and recovery email sequences.
Bounce Rate
Ecommerce average: 35-55%. High bounce rates on product pages suggest poor traffic quality or mismatched expectations. Low bounce rates on collection pages indicate good navigation design.
Using Benchmarks Effectively
Compare your metrics to benchmarks for your specific industry and traffic mix. Set improvement targets of 10-20% per quarter. Focus on metrics where you fall furthest below benchmark — these represent the biggest revenue opportunities.
Below benchmark? Our CRO team identifies exactly what is holding your conversions back.